In today's dynamic business landscape, HR professionals and business leaders are steering their organizations toward success through data-driven insights. HR metrics provide valuable insights into the workforce, enabling HR leaders to make more informed decisions that can improve employee engagement, productivity, and retention.
Shows how much your company spends on average to acquire a new employee.
Cost per hire = [Internal recruitment costs + external recruitment costs] / total number of hires
Significance: Helps your company understand recruitment efficiency, control expenses, and make informed decisions to optimize hiring processes.
The percentage of employees leaving your company within their first year.
First-year attrition rate = (number of employees who left in the first year) / (total number of employees hired in the same year) x 100
Significance: Reveals early turnover issues and the effectiveness of onboarding and employee engagement efforts.
Measures the percentage increase in your company's workforce over a specific period.
Growth rate = [(number of employees in current period - number of employees in previous interval) / (average number of employees x total workdays ] x 100
Significance: Reflects organizational stability and expansion capacity.
The percentage of employees who leave your company and must be replaced during a specific period, typically a year.
Employee turnover rate = Number of employees who left / Average number of employees x 100
Significance: Can be used to assess morale, recruitment costs, and company stability.
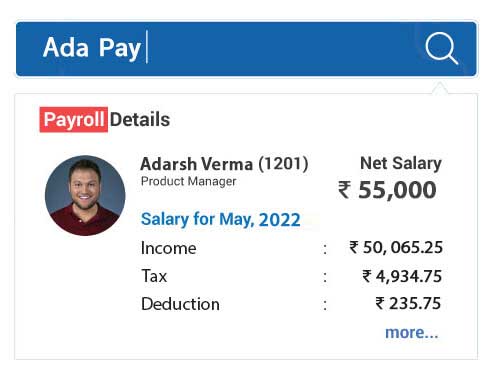
Refers to the typical or mean income earned by individuals in a specific job, department, or geographic area.
Salary average = Sum of all salaries within group / number of employees in group
Significance: Informs you of compensation competitiveness and budgeting decisions.
Measures how an employee's pay falls within the range of their job, indicating their position relative to the salary scale.
Salary range penetration percentage = [(Salary - Range Min.) / (range max. - range min.)] x 100
Significance: Helps find salary equity and employee position within pay scales.
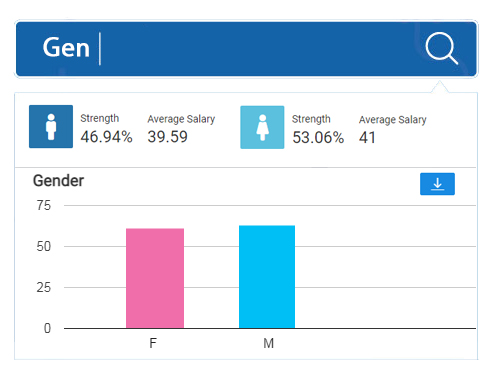
Shows the proportion of different demographic groups in your organization, reflecting inclusivity & representation among employees.
Diversity Ratios = No. of employees in Group 1 : No. of employees in Group 2
Significance: Helps measure inclusivity and fostering a diverse workplace.
Gauges the willingness to recommend your company for employment, reflecting employee satisfaction.
eNPS = [(No. of promoters - No. of detractors) / No. of respondents] x 100
Significance: Assesses employee satisfaction and wellness in your company.
Measures the percentage of absences during scheduled work time.
Absenteeism rate = [No. of absences / No. of expected workdays] x 100
Significance: Reveals satisfaction, motivation, and work environment health.
Calculates company revenue per individual employee, indicating efficiency.
Revenue per employee = Total revenue / Total number of employees
Significance: Demonstrates operational efficiency and revenue generation per team member.
Measures company profit generated per employee, reflecting performance and value.
Profit per employee = (revenue - operational costs) / total number of employees
Significance: Indicates workforce productivity and contributes to profitability analysis.
Shows the percentage of promotions from within your organization.
Internal promotion rate = [(number of internal promotions) / (total number of people who started a new role in the same time period)] x 100
Significance: Highlights talent development and retention strategies' effectiveness.
Calculates expenses related to employee turnover, including recruitment and training.
Average turnover cost = sum of costs associated with turnover / total number of employees who leave the company
Significance: Quantifies the financial impact of employee departures on your company.
Indicates the percentage of employees retained over a specific period.
Employee retention rate = [no. of employees from the original cohort who are still employed / total no. of employees in the organization at the start of that period] x 100
Significance: Measures job satisfaction and effectiveness of retention strategies.
Average duration employees stay with your company.
Average tenure period = total number of months or years a cohort has been employed / number of employees
Significance: Indicates workforce stability and long-term commitment to the organization.
Evaluates the cost of training and development for each employee.
Training cost per employee = total training costs / number of employees
Significance: Evaluates the efficiency of training programs and resource allocation.
Compares salaries between different employee levels within your organization to assess equity.
Internal pay gap = [(Average salary of group 1 - Average salary of group 2) / Average salary of group 1] x 100
Significance: Monitors pay equity and potential morale and turnover issues.
Measures the percentage of successfully executed HR projects or programs.
Initiative completion rate = number of employees who completed the training / total number of employees
Significance: Measures the success of HR projects, impacting organizational goals and culture.
The percentage of job offers accepted by candidates from your company.
Offer acceptance rate = number of offers accepted / number of offers made
Significance: Reflects recruitment effectiveness and the company's attractiveness to candidates.
Refers to the total expenses associated with managing and maintaining your workforce.
Human Capital Cost = Pay + Benefits + Contingent Labor Cost / Full Time Equivalents.
Tracking and analyzing these metrics can help HR leaders identify areas for improvement and develop targeted strategies to address them. For example, if an organization has a high employee turnover rate, HR leaders can investigate the underlying causes and implement strategies to improve employee engagement and retention. Or, if an organization has low diversity ratios, HR leaders can develop DEI initiatives to attract, hire, and retain talent from underrepresented groups.
By tracking and analyzing HR metrics, organizations can gain a deeper understanding of their workforce and make more informed decisions that can lead to a healthier, more productive, and inclusive workforce
At HROnTips, we're passionate about empowering businesses like yours to harness the power of data-backed insights.
To simplify your HR analytics and tracking, try out our innovative AI-powered HR Analytics dashboard that provides real-time insights.
We've assisted both big-scale and small-scale organizations in streamlining and enhancing their People Analytics game.
Book a demo with us to see AI live in action.